All posts by dxie004

SSM v1.0.1 package is released — this site is deprecated: goto https://www.beast2.org/ for up-to-date information

The version 1.0.1 of SSM package is released today (http://doi.org/10.5281/zenodo.995740).

SSM (standard substitution models) is a BEAST 2 package containing the following standard time-reversible substitution models: JC, F81, K80, HKY, TrNf, TrN, TPM1, TPM1f, TPM2, TPM2f, TPM3, TPM3f, TIM1, TIM1f, TIM2, TIM2f, TIM3 , TIM3f, TVMf, TVM, SYM, GTR. More details are available at https://github.com/BEAST2-Dev/substmodels

Regards,
Walter

Using R to estimate probability distribution parameters using quantiles or HPD intervals — this site is deprecated: goto https://www.beast2.org/ for up-to-date information

This post is written by Jordan Douglas.

If you know some of the quantiles of a probability distribution (eg. P(X < 5) = 0.05, P(X < 10) = 0.95) and you know the name of the distribution but you do not know its parameters, then you can use R to estimate them.

This can be done using the cumulative distribution functions (pnorm for normal, plnorm for lognormal, pexp for exponential etc.). Parameter values which yield a small difference between observed and calculated cumulative probabilities can be found using the optim function.

For example, suppose that you want to find mu and sigma parameters of a lognormal distribution such that P(X < 5) = 0.05 and P(X < 10) = 0.95. We start at mu = 1 and sigma = 1.

> mu = 1
> sigma = 1
> x1 = 5
> x2 = 10
> p1 = 0.05
> p2 = 0.95
> plnorm(x1, mu, sigma)
[1] 0.7288829
> plnorm(x2, mu, sigma)
[1] 0.9036418

These initial values are a poor fit.

Next we generate an error function, in this case we minimize the sum of squared differences between calculated and observed cumulative probabilities.

> errorFn = function(params) (plnorm(x1, params[1], params[2]) - p1)^2 + (plnorm(x2, params[1], params[2]) - p2)^2

Finally, we call optim to find estimates for sigma and mu:

> optim( c(mu, sigma), errorFn)
$par
[1] 1.9560118 0.2107083

$value
[1] 5.499438e-11
...

Thus, the estimates for mu and sigma are 1.956 and 0.211 respectively, which have a sum of squared residuals of 5.5e-11.

How to open Tracer and FigTree in macOS Sierra — this site is deprecated: goto https://www.beast2.org/ for up-to-date information

There are two known difficulties when using Tracer v1.6.0 and FigTree v1.4.2 with macOS Sierra:

  • their reliance on a legacy version of Java (6), and
  • Sierra’s stronger Gatekeeper security.

The 1st issue can be solved by downloading the Java for OS X 2015-001. This won’t change the default Java version in Sierra during my test. You can also check it after the installation using the command below:

java -version

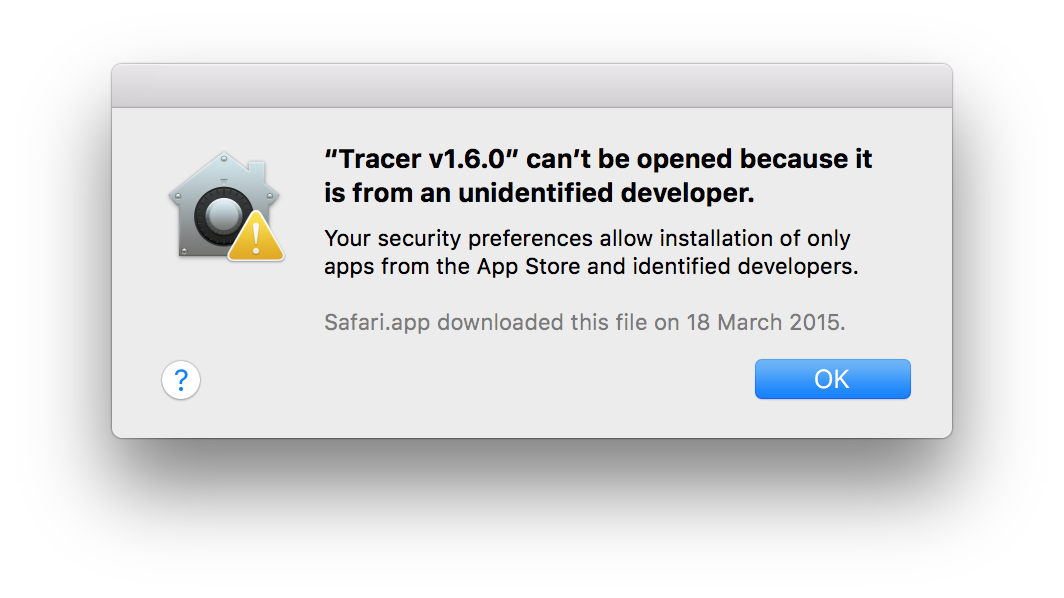
After macOS Sierra introduces a stronger Gatekeeper, the applications not from the App Store and identified developers become difficult to launch after the download. The error message below will pop up when Tracer v1.6 is opened at the first time.

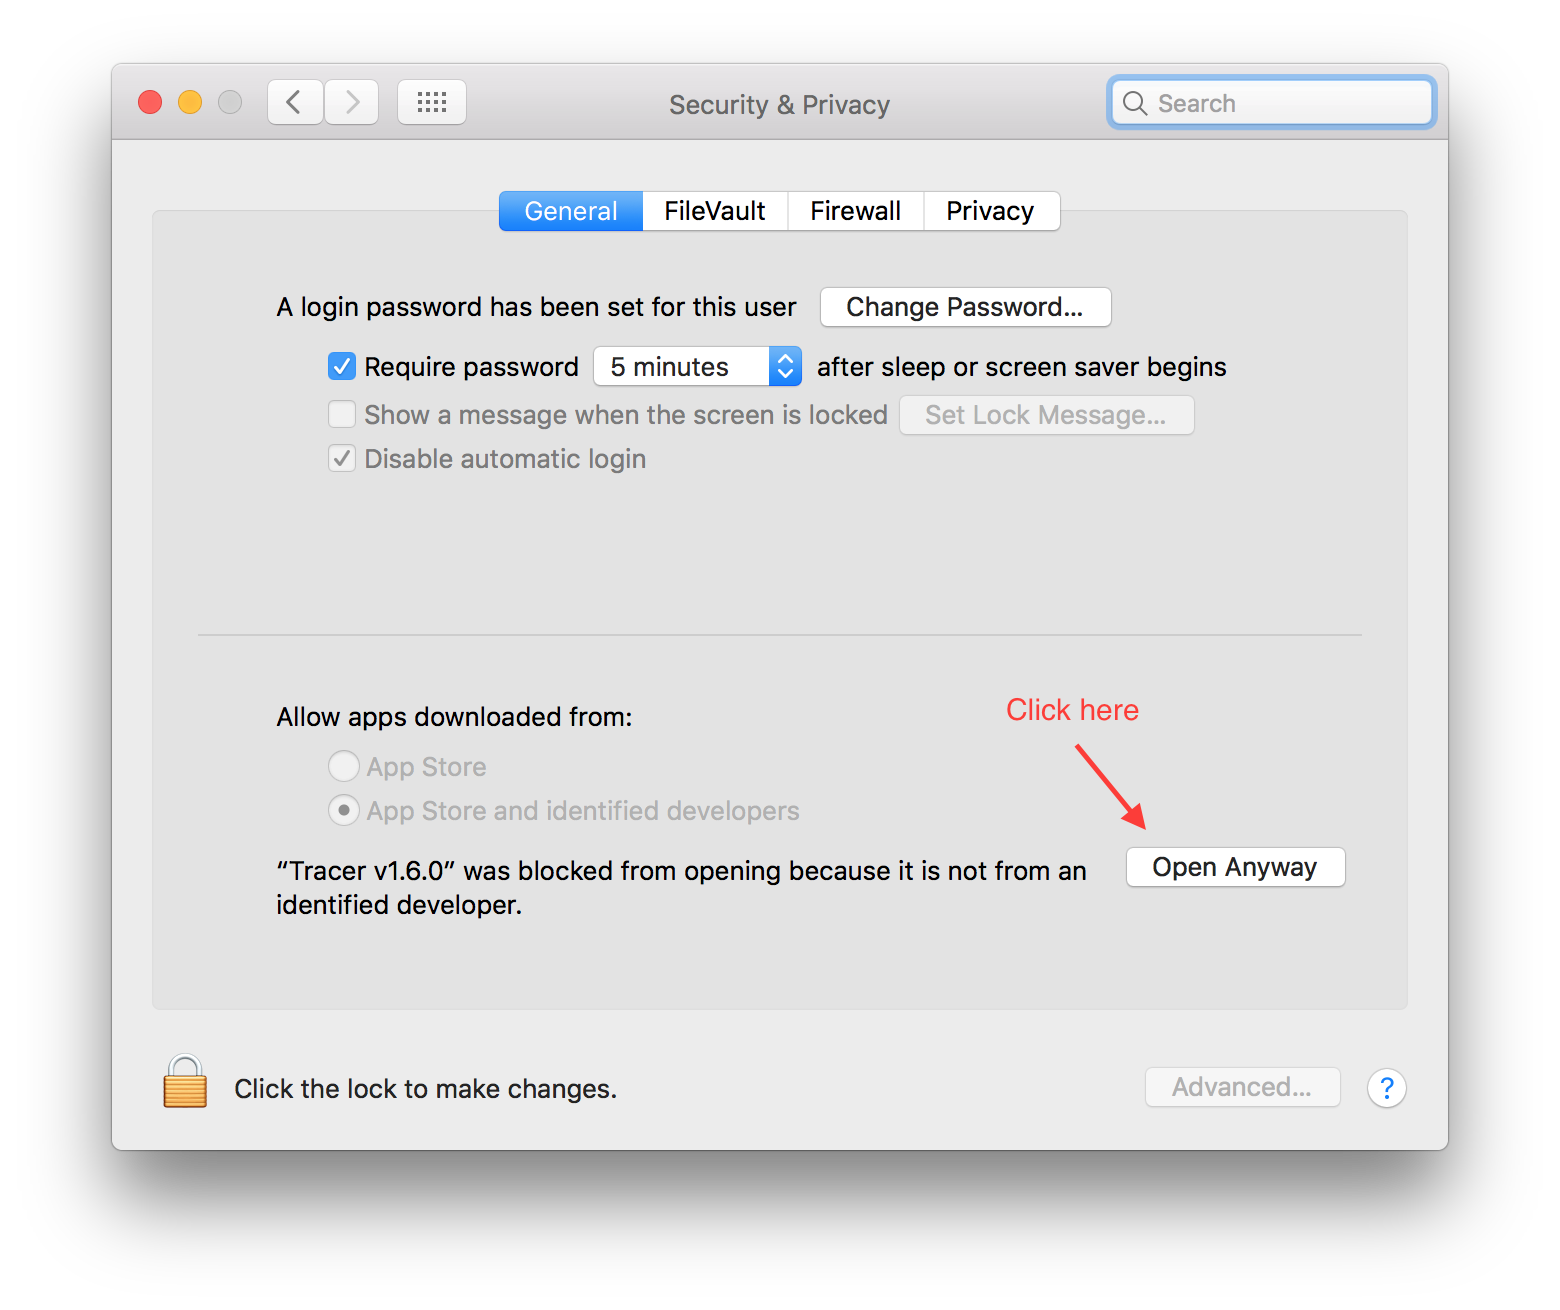
To open the application, find Gatekeeper options in Apple menu > System Preference > Security & Privacy > General tab, and click the button Open Anyway.

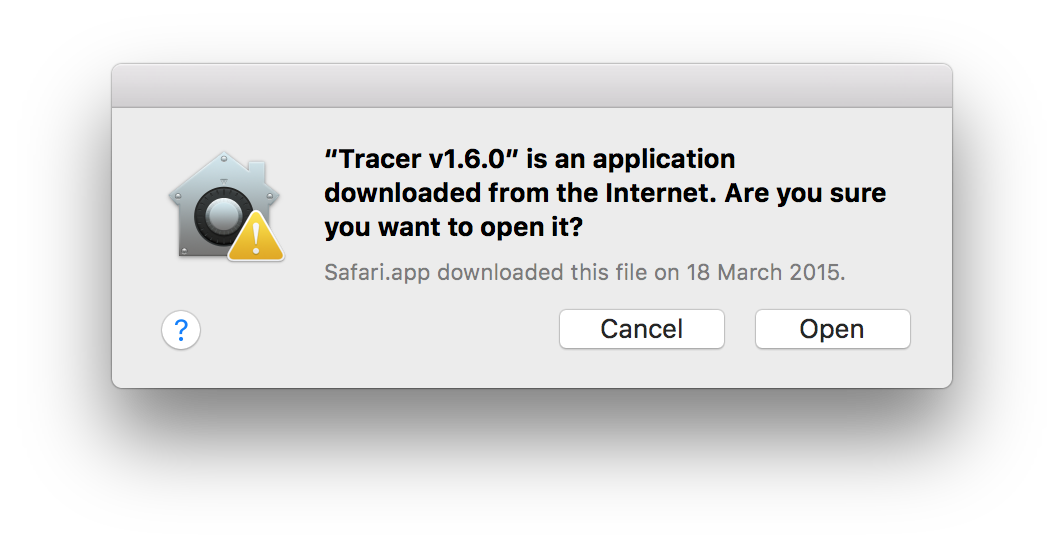
Go back to open the Tracer v1.6.0 application, and choose Open in the dialog box to confirm the process.

After the Tracer or FigTree is successfully opened, you can open them straight away afterwards.

Alternatively, removing com.apple.quarantine from the Tracer application will permanently solve the problem:

xattr -d -r com.apple.quarantine /Applications/Tracer\ v1.6.0.app

Best wishes,
Walter